Charts make it so much easier to understand things. This week's startup is building a no-code solution for news publishers to visualize data.
✍️ Letter from The Editor: Fellowship Opportunity!
To succeed as a founder, you need to have the right people around you. The Day One Fellowship is a 10-week program that places you in a community with peers, mentors, and investors. The program provides office hours with previous founders, pitch opportunities with investors, hands-on guidance from mentors, and startup playbooks to help you level up.
News publishing has been the same for years: walls of text, with some custom-built charts for important news bites, such as a presidential election or a fallout story. But data is everywhere - why don't we have more chart visuals? A few reasons: scarcity (hard to find), inaccessibility (hard to get), technicality (hard to make).
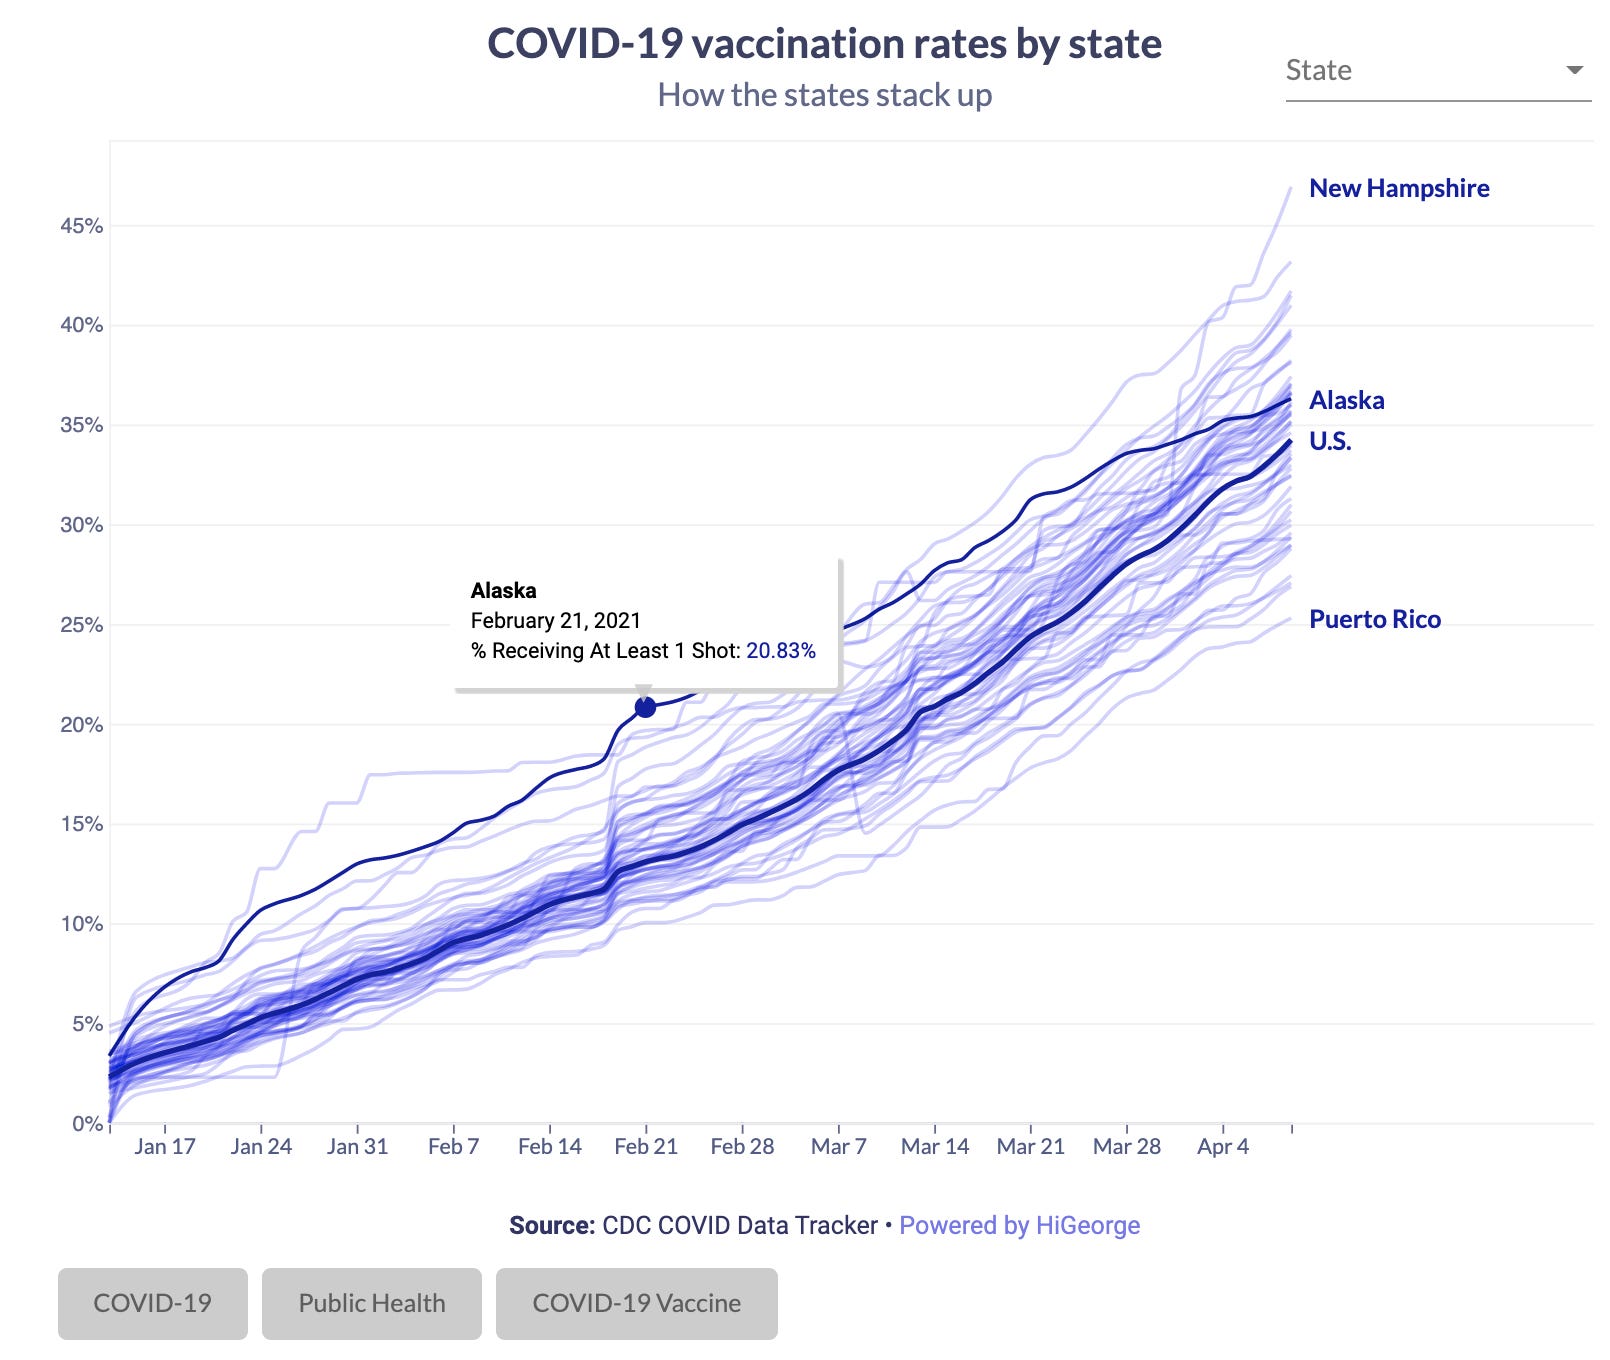
HighGeorge transforming news publishing by creating data visualizations that you can drag-and-drop into articles. No data background required. To do so, HiGeorge has a library that contains a plethora of interactive data visualizations to supplement different articles and storylines - all of which can be localized to any region and customized to meet specific requirements. One simply searches by keyword, topic, or location to find the perfect graph. Then, publishers add the visualization to your article by simply copying-and-pasting an embed code.
👇 The Drop Down
Site: https://hi-george.com/ Founded: 2019 Stage: Seed Trend: Data visualization; no-code Traction: Berkeley SkyDeck Accelerator, YC21, dozens of graph placements in top articles, advisory board with publishers from The Guardian, New York Times, Rotten Tomatoes, and Change.org Team -Talented entrepreneurs Anuj Saigal - CEO Amir Zohrenejad - CTO
🔍 Why we like it
🔥 Desperate use case The number of media players in the last decade has skyrocketed, and each outlet is looking for a way to differentiate. At the same time, share of readers' time has gone down on each news article. HiGeorge helps news publishers (who may be non-technical) fill a need to make their articles easier to read and interesting.
📈 Easy to use HiGeorge takes the fuss out of data visualization and truly owns their process end-to-end. They gather the data, filter it, visualize it, and the only thing to do for publishers is to paste code. That's beautiful.
🔢 Adjacent industries Media isn't the only industry that wants data visualization - and needs a no-code solution to do it. We see Hi George filling data visualizations for other verticals as well, including municipalities, early-stage startups, and research.
One of our previous drops, Kona (previously featured as Sike Insights) is looking for a founding engineer! Here’s a message from Kona:
“Kona helps remote teams build culture. With 70 teams at Greenhouse, Asana, Figma, Medium, and more, we've seen 100% daily engagement and 98% retention. We recently raised $1.1M from Kleiner Perkins, Zillow founder Spencer Rascoff, and more - looking to hire a Founding Engineer to help make work a happier and more connected place :)”